Experimental Evaluation on Latex DRC60 Modified Bituminous Concrete Wearing Course
Bituminous concrete wearing course is that part of the pavement upon which traffic travels which is likely to undergo early deterioration. This necessitates the need for frequent maintenance and there by increases the expenditure. Since the problem of deterioration is related to the properties of bituminous concrete mix, researches have been conducted to improve the properties of the mix using additives like nanomaterials, marble dust, latex etc. The objective of this study is to modify pure bitumen using latex DRC60 and evaluate the physical properties of the blend so as to determine its optimum content in bitumen. Further Marshall mix design was carried out for bituminous concrete layer using the modified latex bitumen blend at various binder contents. The specimens were tested for Marshall stability and flow values as well as the density and void calculations. The studies conducted showed that bitumen modified with latex DRC60 had better physical properties and the modified mix had better strength compared to that of conventional bitumen.
Publication
Keywords
bituminous concrete, latex DRC60, Marshall stability, Marshall flow value, density and void analysis
INTRODUCTION
GENERAL BACKGROUND
Pavement, in civil engineering is a durable surfacing of a road, airstrip, or similar area whose primary function is to transmit loads to the sub-base and underlying soil. Pavements may be either flexible, rigid or semi-rigid, according to their relative flexural stiffness. Rigid pavements are made of Portland cement concrete. Semi-rigid pavements are those having some type of chemically stabilized (pozzolanic) layer below the bituminous concrete layer. A flexible pavement structure is typically composed of several layers of materials each receiving loads from the layers above and spreading it to the next layer below. Bituminous wearing course is that part of the pavement upon which the traffic runs including any dense graded bituminous course immediately below a course of open graded bitumen. One of the major disadvantage of flexible pavement over rigid pavement is early deterioration of surface which can be overcome by improving the physical properties of wearing course. Several ways to improve the physical properties of pavement includes use of additives such as nano materials, latex, marble dust, styrene-butadiene-styrene polymers etc. Conventional bituminous concrete formula using the Marshall method has been shown to fail very rapidly due to heavy traffic and environmental effects. To minimize this deterioration, it is necessary to pay extra attention to material selection and one solution is to formulate an bituminous mix that has a high physical properties and one way to do this is to use latex as an additive.
OBJECTIVE
The objectives of this study include:
- Finding the optimum latex content and binder content in the mix
- Evaluating the changes in unit weight and voids
- Determination of Marshall stability
- Determination of Marshall flow value
SCOPE
Bituminous pavements are subjected to faster deterioration which will result in higher maintenance and operation cost.
- Improving the physical properties of wearing course can increase the strength of the pavement and resistance to deformations, rutting, fatigue as well as skid. On the whole this can improve the overall durability of the pavement.
- Improvement in pavement characteristics like friction and skid resistance can reduce the vehicle operation cost.
- The bitumen used is of VG 30 and latex used of DRC60 so the test results are only comprising to this bitumen grade and latex grade
- If addition of latex can improve these properties it will be a great boon. The increased demand for latex in the bituminous mix design can encourage farmers in the field of rubber plantations. Evaluation of performance of mix will be conducted for various percentages of latex from 0 to 7% and the optimum mix will be selected.
LITERATURE REVIEW
Conventional bitumen has been modified using addition of various additives since years. Among these studies, theone with the addition of crumb rubber was the earliest. Discarded tyres from vehicles were used to modify the bituminous mixes. They were ground to different sizes and graded like aggregates. For a well graded mix, about 10% crumb rubber in bitumen was found to improve the rutting resistance and while gap graded mixes had longer fatigue life but poor rutting resistance (Palit et al. 2004)[9]. Addition of crumb rubber into bitumen was found to be one way of reducing the quantity of waste generated but even then it was uneconomical considering the costs incurred in grinding and grading of the waste tyres. Thus other additives like latex, nanomaterials etc. came into effect and the studies became prominent. Bitumen with 7% latex by weight of bitumen exhibited least temperature sensitivity, enhanced fatigue and rutting resistance (Wen et al. 2015)[5]. On the other hand, 4% latex by weight of bitumen was found to be the optimum content by varying the concentration of latex from 0 to 6% (Siswanto 2016)[1]. The rate of deterioration in the modified mixes were decreased since the addition of latex improved the dynamic stability. Moreover the shelf life of the modified mix was improved due to better dispersion of natural rubber latex in bitumen owing to its small particle size (Siswanto 2017)[3]. About 15% natural rubber latex in bitumen obtained lower penetration value as well as reduced penetration index, increased softening point and highest rutting resistance (Bakar et al. 2018)[6]. The mixing variables like mixing time, mixing temperature and mixing speed had influence on the properties of the modified blends so obtained. These variables affect the dispersion of modifiers in bitumen and thus the strength of the mix thus prepared. A mixing time of 60 minutes, mixing temperature of 160°C and a mixing speed of 1270 rpm was found to be the optimum values of mixing variables (Shaffie et al. 2018)[8]. Later studies were conducted with a combination of additives in bitumen. The optimum content of crumb rubber-HDPE mixture in bitumen was 8% while it was 6% for crumb rubber-LDPE mixture (Ghorpade and Desai 2018)[7].
METHODOLOGY
MATERIALS
The materials to be used are bitumen of VG30, aggregate and latex. The latex to be used in the study is a natural rubber with 60% dry rubber content (DRC). The different levels of latex to be investigated are 0%, 1%, 2%, 3%, 4%, 5%, 6% and 7%. The aggregates must be well graded to be used in the wearing course.
MATERIAL SELECTION AND TESTING
Selection of aggregates
Aggregates suitable for the mix design are selected by testing the various properties of aggregates. The properties tested include:
Strength
Strength of the aggregate is measured in terms of the aggregate crushing value. Sample of aggregates passing through 12.5 mm IS sieve and retained on 10 mm IS sieve were selected and filled into the measuring cylinder in three layers giving 25 blows for each layer. The sample was tested for crushing in the compression testing machine at the rate of 4 tonnes per minute for 10 minutes. The crushed sample was then sieved through 2.36 mm IS sieve.
- (Aggregate crushing value=(Weight of crushed aggregates)/(Total weight of aggregate taken ) ×100) (3.1)
Toughness
Aggregate impact value is taken as the measure of toughness of aggregates. Sample of aggregates passing through 12.5 mm IS sieve and retained on 10 mm IS sieve were selected and filled into the measuring cylinder in three layers giving 25 blows. The sample was then tested for toughness in the impact testing apparatus by giving 15 blows of hammer. The sample thereafter was sieved through a 2.36 mm IS sieve.
- Aggregate impact value= (Weight of sample passing 2.36mm IS sieve)/(Total weight of sample taken) ×100 (3.2)
Particle shape
The particle shape is determined in terms of flakiness and elongation index. The aggregates were sieved through IS sieves of sizes 20 mm, 16 mm, 12.5 mm, 10 mm and 6.3 mm. A certain amount of fraction retained on each of the sieves were taken and passed through the length gauge and thickness gauge. The aggregates passing through the thickness gauge were taken as flaky and those retained on the length gauge were taken as elongated. According to the MORTH specifications shape of aggregates is determined using combined elongation and flakiness index. Flakiness Index test was carried out in the selected sample of aggregates. The flaky particles passing through the respective slots of the thickness gauge were removed and the Elongation Index test was carried out in the remaining non-flaky particles and the Elongation Index so obtained was noted as EI_c.
- Combined elongation and flakiness index = FI +EI_c (3.3) In addition the angularity of aggregates were also tested. Angularity of aggregates is defined as the absence of roundness which is of importance as it affects the interlocking properties of the compacted aggregate layer and the ease of handling the aggregate binder mixture. The test sample passing through 10mm IS sieve and retained on 6.3mm IS sieve were selected for the test and filled in the cylinder of 3 litre capacity in 3 layers giving 100 blows each. The weight of aggregate in cylinder was noted as W g, the weight of water filling the cylinder was taken as C g and the specific gravity of aggregate was determined as G.
- Angularity number =67 - 100W/CG (3.4)
Specific gravity
A sample of coarse aggregate was placed in a wire basket and immersed in water for 24 hours. The sample was weighed in water (W_1). The empty weight of basket suspended in water was also noted (W_2). The aggregates were then taken out and surface dried. The weight of the sample was then noted as (W_3).
- Specific gravity = W_3/(W_3-(W_1-W_2)) (3.5) Specific gravity of fine aggregates were measured using pycnometer. The empty weight was noted. The weight of pycnometer containing fine aggregates was then noted. Thereafter the weight of pycnometer was taken along with the aggregates and water. Finally the weight of pycnometer with water only was measured. Thus the specific gravity was calculated.
Gradation and size
The aggregate sample was of a certain weight were taken and sieved successively through IS sieves of sizes 20mm, 16mm, 12.5mm, 10mm, 6.3mm for coarse aggregates and 4.75mm, 2.36mm, 1.18mm, 0.6mm and 0.3mm for fine aggregates. The results of sieve analysis were reported graphically.
Selection of bitumen
Preliminary tests were conducted to determine the properties and performance of the bitumen. These include:
Penetration test
The bitumen was softened to a pouring consistency and poured into a container to a depth of at least 15mm in excess of the expected penetration. The sample containers were then placed in a water bath at a temperature of 25°C for one hour. It was then taken out and placed under the penetrometer. The needle was adjusted to make contact with the surface of sample. The dial was set to zero and the needle was released for 5 seconds. The reading from the dial gauge was taken.
Softening point test
The softening point of bitumen was determined by the Ring and Ball test. A brass ring containing test sample of bitumen were suspended in a beaker with liquid water bath. A steel ball was placed on the bitumen sample and the liquid medium was then heated at the rate of 5°C per minute. The temperature at which the softened bitumen touches the metal plate placed at a specified distance below the ring was recorded as the softening point of bitumen.
Specific gravity test
The specific gravity of bitumen was determined using a pycnometer. The specific gravity was obtained by dividing the weight of bitumen by weight of equal volume of water.
Ductility test
The ductility value is expressed as the distance in centimetre to which the bitumen specimen of standard size can be stretched before the thread breaks. The standard briquette specimen of cross section 10 mm × 10 mm was tested at 27°C with a rate of pull of 50 mm per minute. The distance upto the point of breaking of thread was reported as the ductility of bitumen.

Specimen preparation
Approximately 1200gm of aggregates and filler is heated to a temperature of 175-190ºC. Binder is heated to a temperature of 121-125ºC with the first trial percentage of binder as 5% by weight of the mineral aggregates. The heated aggregates and bitumen are thoroughly mixed at a temperature of 154-160ºC. The mix is placed in a preheated mould and compacted by a rammer with 50 blows on either side at temperature of 138ºC to 149ºC. The weight of mixed aggregates taken for the preparation of the specimen may be suitably altered to obtain a compacted thickness of 63.5±3 mm. Vary the bitumen content in the next trial by +0:5% and repeat the above procedure. The latex-bitumen contents investigated varied from 5.0% to 7.0% of total mixture weight. Three specimens were prepared for each latex-bitumen content. Four levels of latex content were investigated in this study, at 0%, 2%, 4% and 6% latex by weight of bitumen respectively.
Density and Voids Analysis
All mix design methods use density and voids to determine basic HMA physical characteristics. Two different measures of densities are typically taken:
- Bulk specific gravity (Gmb).
- Theoretical maximum specific gravity (TMD, Gmm).
These densities are then used to calculate the volumetric parameters of the HMA. Measured void expressions are usually:
- Voids in the total mix (VIM)
- Voids in the mineral aggregate (VMA)
- Voids filled with bitumen (VFB)
The Marshall Stability and Flow Test
The Marshall stability and flow test provides the performance prediction measure for the Marshall mix design method. The stability portion of the test measures the maximum load supported by the test specimen at a loading rate of 50.8 mm/minute (2 inches/minute). Basically, the load is increased until it reaches a maximum then when the load just begins to decrease, the loading is stopped and the maximum load is recorded.
During the loading, an attached dial gauge measures the specimen’s plastic flow as a result of the loading.
The flow value is recorded in 0.25 mm (0.01 inch) increments at the same time the maximum load is recorded.
The apparatus of Marshall stability test is shown in fig.3.1.

Selection of Optimum Bitumen Binder Content
The optimum bitumen binder content is finally selected based on the combined results of Marshall stability and flow, density analysis and void analysis. Optimum bitumen binder content can be arrived at in the following procedure:
Plot the following graphs:
- Bitumen binder content vs. density: Density will generally increase with increasing bitumen content, reach a maximum, then decrease. Peak density usually occurs at a higher bitumen binder content than peak stability.
- Bitumen binder content vs. Marshall stability: This should follow one of two trends: Stability increases with increasing bitumen binder content, reaches a peak, then decreases. or Stability decreases with increasing bitumen binder content and does not show a peak. This curve is common for some recycled HMA mixtures.
- Bitumen binder content vs. flow.
- Bitumen binder content vs. air voids. Percent air voids should decrease with increasing bitumen binder content.
- Bitumen binder content vs. VMA. Percent VMA should decrease with increasing bitumen binder content, reach a minimum, then increase.
- Bitumen binder content vs. VFB. Percent VFB increases with increasing bitumen binder content.
Determine the bitumen binder content that corresponds to the specifications median air void content (typically this is 3-5 percent). This is the optimum bitumen binder content.
Determine properties at this optimum bitumen binder content by referring to the plots. Compare each of these values against specification values and if all are within specification, then the preceding optimum bitumen binder content is satisfactory.
Latex-Bitumen Blend Preparation
The latex-bitumen blends were prepared by heating the bitumen to a pouring consistency in a pan at 135 to 140°C. Later, accurately measured quantity of DRC-60 latex was added at different percentages; 0%, 2%, 4%, 6%, 8% and 9%. The blends were then tested for penetration, softening point, specific gravity and ductility. The percentage of latex by weight of bitumen in the latex-bitumen blend which yield better results in these tests were fixed to be the optimum value. Further the results obtained were compared to the test results for pure bitumen.
Marshall Mix Proportioning and Design
Three categories of aggregate samples A, B and C were proportioned to prepare Marshall specimens. These samples were sieved and batched as per MORTH specification for BC grading II shown in TABLE using trial and error method
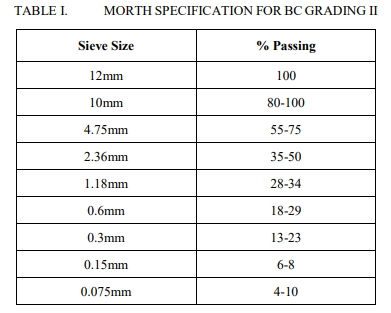
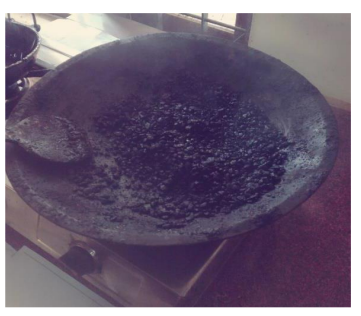
The proportion of aggregates were fixed using the following equations (1) and (2). P = Aa + Bb + Cc … (1) a + b + c + …= 1.00 (2) About 1200g of this batched aggregate was heated to 175 to 190°C. The bitumen was heated in parallel to a pouring temperature of 140°C to which measured amount of latex was added. The blend was then stirred thoroughly, poured onto the heated aggregate and evenly mixed as shown in fig. 2. The mix is placed in a preheated mould and compacted by a rammer with 75 blows on either side. The bitumen content was varied in the next trial by +0.5% and the above procedure was repeated from 5.0% to 7.0% of total mixture weight. Three specimens were prepared for each latex-bitumen content. Four levels of latex content were investigated in this study, at 0%, 2%, 4% and 6% latex by weight of bitumen respectively. The Marshall stability and flow value of the modified mixes were then studied in comparison with those made with pure bitumen using Marshall apparatus. Further density and void calculations were also conducted.
RESULTS AND DISCUSSIONS
GENERAL
The results of the preliminary tests conducted on aggregate and bitumen are as follows.
RESULTS OF AGGREGATE TESTING
A sample of aggregates was taken and the following observations were recorded.
Aggregate Crushing Value
The aggregate crushing value should not be more than 30 % for aggregates used in bituminous surface dressing.
The recorded observations of the crushing strength test are shown in Table 4.1.
Table 4.1 Test results of aggregate crushing strength test
 The obtained value of 26.925 % was found to be less than this limit. Hence the aggregates are satisfactory.
Aggregate Impact Value
The aggregate impact value should not be more than 30 % to be used in wearing course as per the MORTH
specifications. The results of aggregate impact test are as shown in Table 4.2
Table 4.2 Test results of aggregate impact test
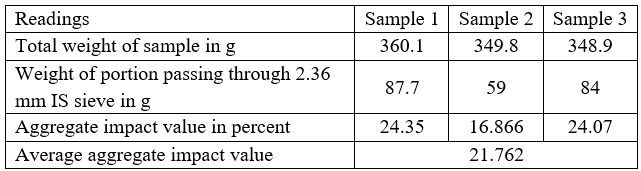 The tested sample therefore falls within the desired limit. Moreover, it is satisfactory for road surfacing.
Flakiness Index
As per the IRC recommendations, the maximum limit of flakiness index of aggregates to be used in surface
course is 25%. The results of the test are as shown in Table 4.3.
Table 4.3 Test results of flakiness index test
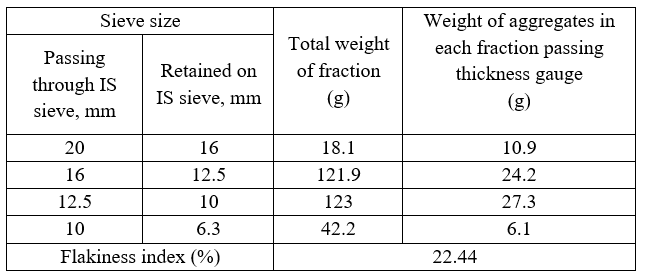 The obtained flakiness index lies within the permissible limits. Hence the aggregates are suitable for
surface dressing.
The obtained flakiness index lies within the permissible limits. Hence the aggregates are suitable for
surface dressing.
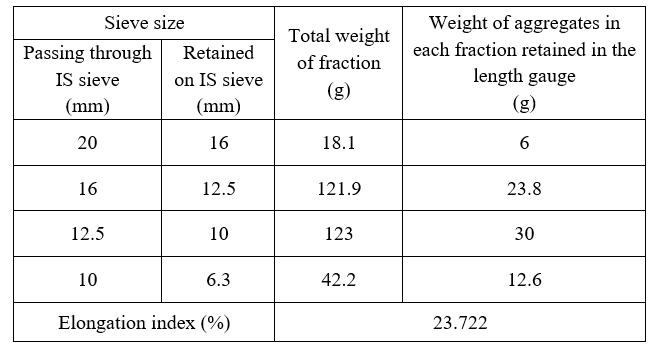
Elongation Index
The permissible limit of elongation index of aggregate is 25%. The recorded observations of elongation test
is shown in Table 4.4. The elongation index obtained is 23.722 % which is within the desired limits.
Table 4.4 Test results of elongation index test
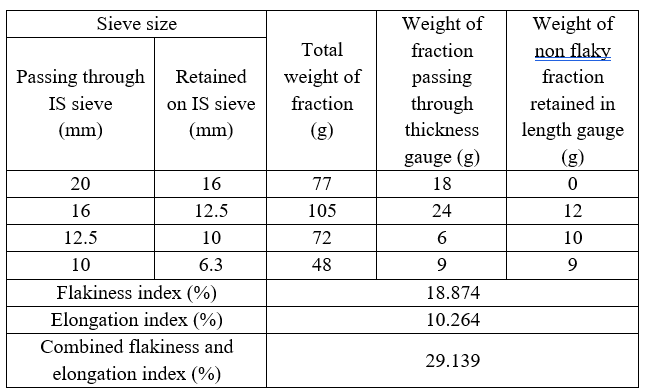
Combined Flakiness and Elongation Index
As per the MORTH specifications, combined flakiness and elongation index must be less than 30%. The obtained
results of the test are as shown in Table 4.5, which shows the combined flakiness and elongation index as
29.139% and it is less than the permissible limits.
Table 4.5 Test results of combined elongation and flakiness index test
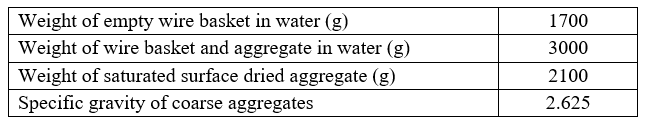
Specific Gravity of Coarse Aggregates
Table 4.6 shows the observations of the test for specific gravity on coarse aggregates. The specific gravity
of aggregates used in road construction usually ranges from 2.5 to 3 with an average of 2.68. The obtained
value of 2.625 lies within the desirable limits.
Table 4.6 Test results of specific gravity of coarse aggregates
Specific Gravity of Fine Aggregates
Specific gravity of fine aggregates were determined using pycnometer method. The obtained specific gravity
lies within the range of 2.5 to 3. The observations are shown in table 4.7.
Table 4.7 Test results of specific gravity of fine aggregate

Angularity of Aggregates
The angularity number of aggregates generally ranges from 0 for highly rounded particles to about 11 for
freshly crushed angular aggregates. The test
results shown in Table 4.8 gives an angularity number of 8, which suggests that the aggregates are nearly
angular.
Table 4.8 Test results of angularity of aggregates

Gradation and Size of Aggregates
Table 4.9 shows the test results obtained in the sieve analysis of aggregates. The gradation curve was then
plotted as shown in Fig 4.1 which was found to be an S shaped curve. This indicates that the aggregates are
well graded.
Table 4.9 Test results of sieve analysis of aggregates


RESULTS OF BITUMEN TESTING
A sample of bitumen was taken and the following observations were recorded after different tests.
Penetration Test on Bitumen
The penetration value of bitumen was determined using a penetrometer and was found to be 65. Hence it belongs to the penetration grade 60/70.
Softening Point Test on Bitumen
The obtained softening point temperature of bitumen was found to be 64.1°C. Hence the bitumen can be used at higher temperatures.
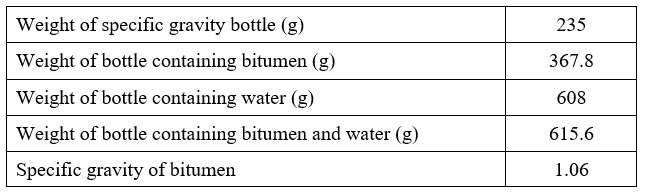
Specific Gravity of Bitumen
Specific gravity of pure bitumen is expected to be in the range of 0.97 to 1.1. The specific gravity obtained
as shown in Table 4.10 is 1.06, which is within this limit.
Table 4.10 Test results of specific gravity of bitumen
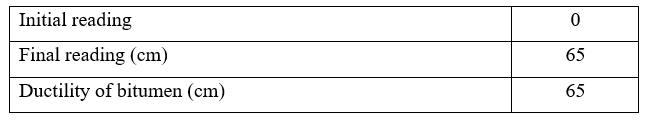
Ductility Test on Bitumen
The ductility value obtained for the bitumen is 65 cm as shown in table 4.11. Hence the bitumen can be used
at higher traffic loads and it does not get cracked easily.
Table 4.11 Test results of ductility test on bitumen
Tests on Latex-Bitumen Blend
The tests conducted on the latex-bitumen blend obtained the following results shown in TABLE
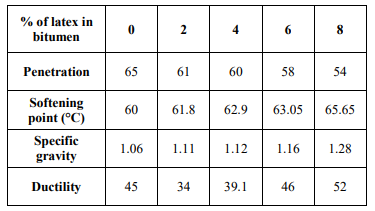
It can be inferred from the table that for the blend with 8% latex by weight of bitumen, all the properties were improved compared to the base bitumen. Further a trial blend of 9% latex by weight of bitumen was also prepared for testing. However, this blend prepared resulted in a thick blend with reduced workability. Increasing the percentage of latex in bitumen gradually reduced the workability. Hence, the blend with 9% of latex content was discarded and further tests were not conducted on the same. Thus 8% of latex by weight of bitumen was selected to be the optimum latex content in the modified blend.
Results of Mix Proportioning
Bituminous concrete mix design was carried out for both the base bitumen and the bitumen modified with an optimum latex content of 8%. The aggregates were proportioned and batched as shown in TABLE V and VI.

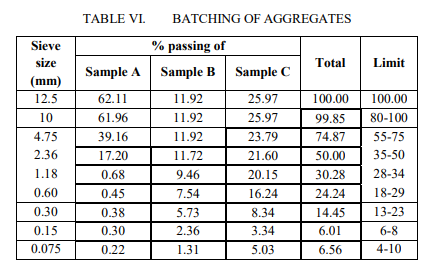
The proportioning was in agreement with the MORTH specification. Hence, it was fixed that for the preparation of Marshall mix specimens, out of a total of 1200g aggregates, about 62% will be Sample A, 12% will be Sample B and 26% will be Sample C.
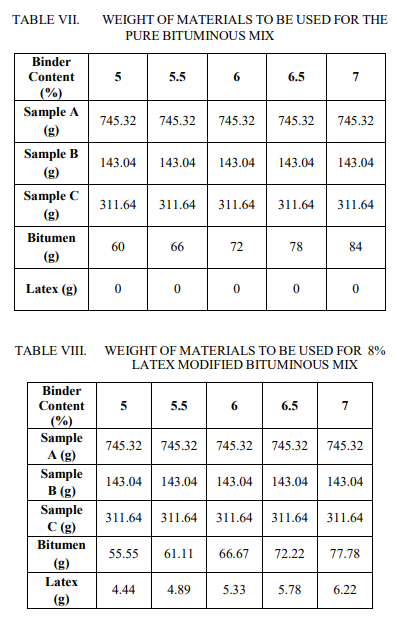
The weight of materials to be selected for the bituminous mixes were as shown in TABLE VII and VIII. Three samples were prepared for various binder contents from 5% to 7% and were then tested in the Marshall apparatus for stability and flow value. Further, density and void calculations were done. The results thus obtained for the mixes with base bitumen and modified bitumen were then compared to determine the optimum binder content for the modified mix.
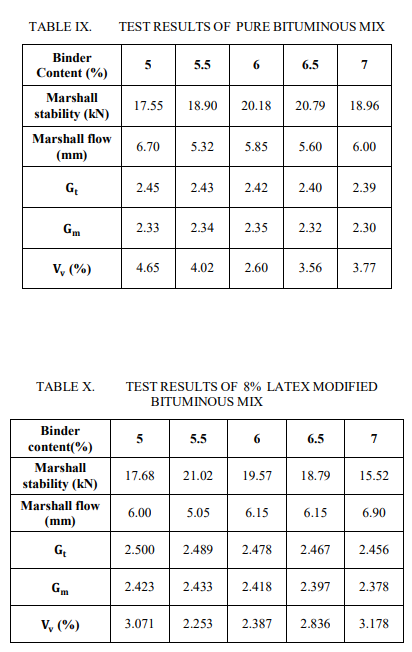
Results of Tests on Bituminous Concrete Mixes
The maximum load which each of the specimen of different binder content at 0% and 8% latex-bitumen blend could withstand were determined along with the deformation occurred at that time. The theoretical specific gravity (Gt) and bulk specific gravity (Gm) for the specimens were calculated. These values were then used to calculate the volumetric parameters of specimens like percentage of air voids (Vv) and percentage volume of bitumen (Vb). The results obtained are as shown in TABLE IX and X below.
These test results were analysed graphically for Marshall stability, flow value bulk specific gravity and percentage air voids in order to compare the variation in properties of latex modified mix with that of pure bituminous mix. For this, graphs were plotted with Marshall stability, flow value, bulk specific gravity and percentage air voids against binder content as shown in fig. 3.to 7.

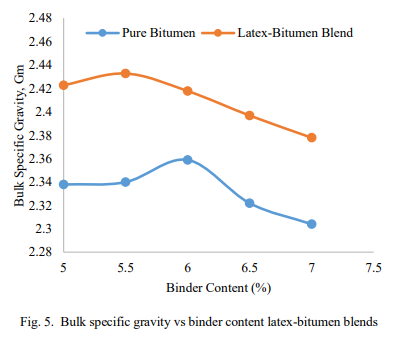
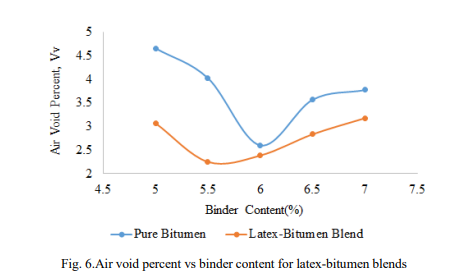
It was observed that the peak values of Marshall stability, bulk specific gravity and the minimum value of Marshall flow was around 6 to 6.5% of binder content for specimen with pure bitumen and was around 5 to 6% of binder content for specimens with 8% latex content. On an average, the optimum binder content for pure bitumen specimens was fixed as 6.14% and that of 8% latex-bitumen blend was 5.55%. For the purpose of study, specimens with 7% latex-bitumen blend were also prepared for different binder contents and all the above parameters were studied. But the results obtained were poor compared to the specimens of 8% latex-bitumen blend. Hence, a binder content of 5.55% with 8% latex in bitumen was found to the best mix.
CONCLUSIONS
In this study, the performance of latex DRC60 modified bituminous concrete wearing course was studied. The properties of base materials were first studied and then the optimum content of latex DRC60 to be added to modify the bitumen was estimated, which was found to be 8% by weight of bitumen. The bituminous concrete mix proportioning was done and the Marshall specimens were prepared with 0% and 8% latex-bitumen blends for a binder content of 5, 5.5, 6, 6.5 and 7%. On testing the specimens it was found that the addition of latex DRC60 could improve the strength of the mix as well as reduce the deformations. Each of the preliminary tests conducted to determine the properties of aggregates and bitumen suggests their suitability to be used in the wearing course of pavement. The tests conducted on bitumen modified with 0, 2, 4, 6 and 8% latex revealed that
- The penetration of bitumen decreases, while the softening point, ductility and specific gravity increases with increase in latex content.
- The optimum values for the tests were obtained for 8% latex in bitumen. A trial blend of 9% latex was prepared and discarded since the workability offered was poor.
- The lower penetration value and higher ductility and softening point suggested that the blend could be used in warmer regions.
With this 8% latex modified bitumen, mix proportioning was done which satisfied the MORTH specifications. The samples with pure bitumen and modified bitumen were prepared, tested and compared for Marshall stability and flow value as well as for density and void analysis which showed that
- The peak of Marshall stability and bulk specific gravity and the valley of Marshall flow value were obtained at lower binder contents for samples of modified bitumen compared to samples of pure bitumen.
- The optimum binder content for modified bituminous mix was thus found to be 5.55% while it was 6.14% for pure bituminous mix.
- This suggested that the desired strength and durability is obtained with modified bituminous mix and that it can reduce about 16% of bitumen in the mix compared to pure bituminous mix.
- Trial mix specimens prepared for 7% latex in bitumen was discarded as it obtained poor results. Thus, a bituminous mix with 8% latex by weight of bitumen at 5.55% binder content was fixed to be the optimum mix.
REFERENCES
- H.Siswanto, (2016), “Improving the physical properties of asphalt concrete bearing course using latex DRC60”, Journal of American Institute of Physics, Vol.1778, pp.126-132.
- H.Siswanto,(2017), “ Improving water resistance of asphalt concrete wearing course using latex-bitumen binder” MATEC Web of Conferences, Vol.97, pp.320-326.
- H.Siswanto, (2017), “The effect of latex on permanent deformation of asphalt concrete wearing course”, Journal of Procedia Engineering, Vol. 171, pp.1390-1394.
- S.K. Khanna, C.E.G. Justo and A. Veeraragavan. Highway Engineering, Khanna publishers
- Y.Wen, K.Zhao, Y.Wang, and A.Sumalee, (2015). “The use of natural rubber latex as a renewable and sustainable modifier of asphalt binder”. International Journal of Pavement Engineering.Vol.18, No.6.
- S.K.A.Bakar, et al., (2018). “Evaluating the rheological properties of waste natural rubber latex modified binder”. E3S Web of Conferences 34,01037 (2018).
- M.R.Ghorpade, D.B.Desai, (2018). “A study of enhancement of bituminous mix by use of modifiers”. Imperial Journal of Interdisiplinary Researches (IJIR), Vol. 4, No.1.
- M.G.Krishnapriya, (2015). “Performance evaluation of natural rubber modified bituminous mixes.” Journal of Civil, Environmental, Water resources and Infrastructure Engineering Research (JCSEWIER), Vol.5, No.1
- https://www.britannica.com/technology/road/The-modern-road
- https://www.britannica.com/technology/pavement-civil-engineering
- https://www.pavementinteractive.org/reference-desk/design/mix-design/marshall-mix-design
- https://nptel.ac.in/courses/105101087/downloads/Lec-26.pdf